A working glossary of Google Search Console terms for enterprise SEO teams. Grouped the way GSC itself is organized — properties, performance, indexing, page experience, links, and crawl stats — with a plain definition first for each term.
Properties and setup
Domain property
A domain property is a Google Search Console property that aggregates data across every subdomain and protocol of a domain, reporting all of it at the sitewide level. Crawl errors, search performance, and other metrics from individual URL-prefix properties roll up into one domain-level view.
For example, a domain property for uxseo.com totals the data from all of these:
| HTTPS | https://uxseo.com |
| non-HTTPS | http://uxseo.com |
| Naked sub-domain | https://uxseo.com |
| Sub-domain | https://www.uxseo.com |
| Sub-folder | https://uxseo.com/gsc/ |
Domain properties require DNS verification, which can make them a pain to set up inside large enterprises. They are most useful for finding stray lower-level testing or staging environments that have slipped into Google’s index, planning website migrations (MDOT moves, HTTP-to-HTTPS, redesigns, replatforms), and getting a holistic read on site speed, rich results, and crawl errors across the whole domain.
URL prefix (individual property)
A URL-prefix property is a Search Console property scoped to one exact subdomain and protocol — https://uxseo.com, but not http:// and not www.. It gives more granular data than a domain property, so you can split a large site into subdomains and subfolders and analyze each on its own.
One practical reason to use them: the GSC dashboard caps many reports at 1,000 rows. A domain property might show only 100 of your product pages, while the subfolder property those pages live under shows all 1,000.
Ownership verification
Ownership verification is how you prove to Google that you control a property before it will show you any data. Search Console accepts several methods:
- Domain name provider — add a DNS record at your registrar (required for domain properties)
- HTML file — upload a verification file to your server’s root
- HTML tag — add a meta tag to your homepage
<head> - Google Analytics — verify through an existing GA tag on the site
- Google Tag Manager — verify through an existing GTM container
Change of address
The Change of Address tool tells Google you have moved a verified site to a new domain, so it transfers signals and speeds up the migration of rankings from the old domain to the new one. Use it alongside 1:1 301 redirects, never instead of them.
Users and permissions
Permissions control who can see and manage a property, across three roles: Owner (full control, including adding and removing users), Full user (sees all data and takes most actions), and Restricted user (view-only access to most reports).
Associations
An association links a Search Console property to other Google products — Analytics, YouTube, Google Ads, Play — so data can flow between them. An association is not the same as verified ownership; it simply connects two properties you already control.
Overview and Insights
Overview
The Overview page is the landing page you see when you first open a property in Google Search Console. It shows high-level trends for organic search traffic, indexing and crawl errors, and structured-data enhancements, with links into each detailed report.
Search Console Insights
Search Console Insights is a simplified report that surfaces basic keyword and page statistics for business owners, creators, and webmasters who don’t have the time or expertise to dig through every GSC report. Google introduced it in late 2021 for exactly that less-technical audience.
Performance report
Performance
The Performance report is the most useful report in Google Search Console for analyzing trends, opportunities, and ideas. Its four key metrics are Impressions, Clicks, Click-through Rate, and Average Ranking Position, and you can view them at page, folder, subdomain, domain, or custom-RegEx level.
You can break performance down by pages, queries, devices, countries, search types, and rich-result types. The report holds up to 16 months of data (the older report offered only three), which lets you run true year-over-year comparisons and spot your durable top performers rather than short-term spikes.
The dashboard caps exports at 1,000 rows. To pull tens of thousands, use the Search Console API through the Search Analytics for Sheets add-on, the SEO Tools for Excel add-on, or your own API connection in Python. Pair that GSC data with on-site analytics (Google Analytics, Adobe Analytics) and you get a holistic view of impressions turning into clicks, orders, and revenue.
Impressions
An impression is counted each time one of your pages appears in a Google search result for a user, whether or not they scroll to it or click.
Clicks
A click is counted each time a user clicks through from a Google search result to your page.
Click-through rate (CTR)
Click-through rate is clicks divided by impressions — the share of searches where your result appeared and the user actually clicked it.
Average ranking position
Average ranking position is the best rank-tracking metric in SEO because Google reports real-world rankings for every user search, every ranking page, every device, and every country, aggregated for you. Its one weakness is aggregation: average it across everything (all queries, all pages, all properties) and the number becomes low-signal.
Read it at the exact-query and exact-URL level instead, so the average isn’t skewed. The average position for a single keyword across one to three URLs in the United States on mobile is a high-signal number. A better metric still — one Google doesn’t yet offer — would be a Weighted Average Ranking Position based on impressions or clicks.
Query, page, device, country
These are the dimensions you slice the Performance report by: Query (the search term), Page (the ranking URL), Device (mobile, desktop, tablet), and Country (where the search happened). Every metric above can be filtered or grouped by any of them.
Search type
Search Type is a filter in the Performance report that separates at least four kinds of Google results:
- Web: traditional blue links and certain rich results in organic results.
- Image: your images served under the “All” results tab and the “Images” tab.
- Video: videos in carousels and featured snippets in general results, plus placements under the “Videos” tab.
- News: your articles appearing in Google News in the “All” and “News” tabs.

Web results are the standard, but some sites — News publishers especially — draw meaningful traffic across all four types. You default to Web data, and you can compare two search types against each other, or one search type across two date ranges.
Date range
The Date Range control sets the window for Performance data. Default ranges run from the most recent date through the last 7, 28 days, 3, 6, 12, or 16 months, plus a custom range up to 16 months. Comparison ranges include period-over-period (last 7 days vs. previous 7) and year-over-year (last 28 days vs. previous year).
Tip: for year-over-year, use a custom range aligned to the same days of the week. To compare Wed 06/01/2022–Tue 06/14/2022, set the prior range to Wed 06/02/2021–Tue 06/15/2021. That’s the truest apples-to-apples read.
Last updated
Last Updated is a label in the Performance report telling you when Impressions, Clicks, CTR, and ARP were last refreshed, and whether the most recent date’s data is partial or full. If it’s 2:00 pm PT and Last Updated reads “12 hours ago,” Google refreshed at 2:00 am, so all of yesterday’s data is final. In the evening, today’s date shows as the most recent date but holds only partial data.
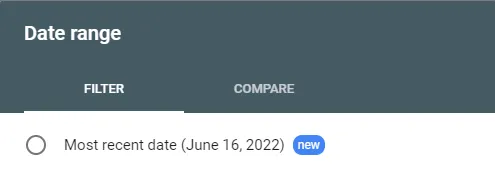
Per Google, all dates are recorded and displayed in Pacific Time.
Dates
The Dates dimension is a daily, dated report of Performance data — ideal for building your own internal rank tracking. It’s nearly useless in the GSC dashboard but excellent once you pull it into Excel or Google Sheets, where you can chart daily ranking trends for the whole domain, a single property, a section, a handful of URLs, or one URL with thousands of queries.
Filter it by rich results, country, device, or search type, and use RegEx for precise segments. You can require a minimum impression or click threshold to isolate top performers — for example, RegEx to define product-page URLs, then a filter for pages with more than 500 impressions. Because it’s Google’s own first-party data, aggregated for every searcher in the world, no enterprise rank tracker matches it for accuracy or granularity. Pair it with conversion analytics for end-to-end journey reporting, from search to delivered order.
Queries and URLs filters
These controls filter every tab of the Performance report by query or by page URL. “Containing” and “Not containing” match or exclude an exact string; “Exact” matches a single term or URL; and “Custom (RegEx)” matches multiple patterns at once using regular-expression syntax.
| Control | Query | Page | Search Appearance | Device | Country | Dates |
| Queries containing | A list of queries (search terms) which include the exact string | A list of aggregated data by URLs, which were only shown in Google when user searched term containing string | Different types of Rich results that were generated when user searched term containing string | Mobile, desktop, tablet performance for all instances where user search term contained exact string | Visibility in Google Search worldwide results by Country, where user searched term containing exact string in English or in the local language | Daily rank tracking data aggregated by only queries containing exact string |
| Queries Not Containing | Same as above, but it inversely excludes the exact string | Same as above, but it inversely excludes the exact string | Same as above, but it inversely excludes the exact string | Same as above, but it inversely excludes the exact string | Same as above, but it inversely excludes the exact string | Same as above, but it inversely excludes the exact string |
| Exact Query | A single search term. What you put in is what you get. | All URL data per the same query | All Rich Results appearing per the same query | Same as above per the exact query | Performance by Country for same query | Daily rank tracking for single keyword |
| Queries Custom (RegEx) | Fetches queries that match multiple containing or not-containing patterns, using Regular Expressions syntax. | Fetches URLs that match various patterns, using Regular Expressions syntax. | Fetches rich results that match various patterns, using Regular Expressions syntax. | Fetches device data that matches various patterns, using Regular Expressions syntax. | Fetches country data that matches various patterns, using Regular Expressions syntax. | Fetches daily data that matches various patterns, using Regular Expressions syntax. |
The same logic applies to the URL filters (URLs containing, not containing, exact, and custom RegEx), except it matches against page URLs instead of queries — for example, “top keywords by impressions and clicks for all my product URLs,” or a mobile-vs-desktop breakdown for one section of the site.
Search appearance and rich results
Search appearance
Search Appearance is a tab in the Performance report that shows organic-visibility trends for rich results (rich snippets) in the SERPs. Those results come mainly, though not only, from schema and structured-data markup — common ones include Products, Reviews, Recipes, How-Tos, Videos, and FAQs. Google has also folded engagement measures like Good Page Experience into this view.
Web Light results
Web Light results are the Clicks, Impressions, CTR, and Average Ranking Position data for users served Google Web Light pages — bare-bones, stripped-down versions of your content shown on slow (3G and below) connections.
FAQ rich results
FAQ rich results are a rich-result type in the Search Appearance tab that reports Impressions and Clicks from FAQ snippets in Google Search. When you apply FAQ schema, Google extracts the questions and answers from your ranking page and displays them in the SERP — which can lower your CTR (the user got their answer) or raise it (the preview pulls them in).
To weigh the trade-off, add the impressions and clicks of the ranking URL to those of its FAQ rich result, then compare CTR across a before-and-after date range.
Should you still mark up FAQs? Yes and no. Yes, because the more structured data you share, the more Google leans on your contributions to build its knowledge graph. No, because the more Google leans on you, the more it can engineer answers where Google, not your site, is the destination. But if you don’t provide it, a competitor will — so keep shipping schema. At worst, your FAQs are creating quality, memorable impressions with thousands of users for free, which makes them excellent brand builders.
Enhancements
Enhancements are Search Console reports that track the validity of specific structured-data types on your site, flagging errors, warnings, and valid items for each. Common ones include Breadcrumbs, FAQ, and Sitelinks Searchbox.
Discover
Discover appearance
Discover Appearance is a report in the Discover Performance dashboard that shows the source of your Google Discover impressions and clicks.
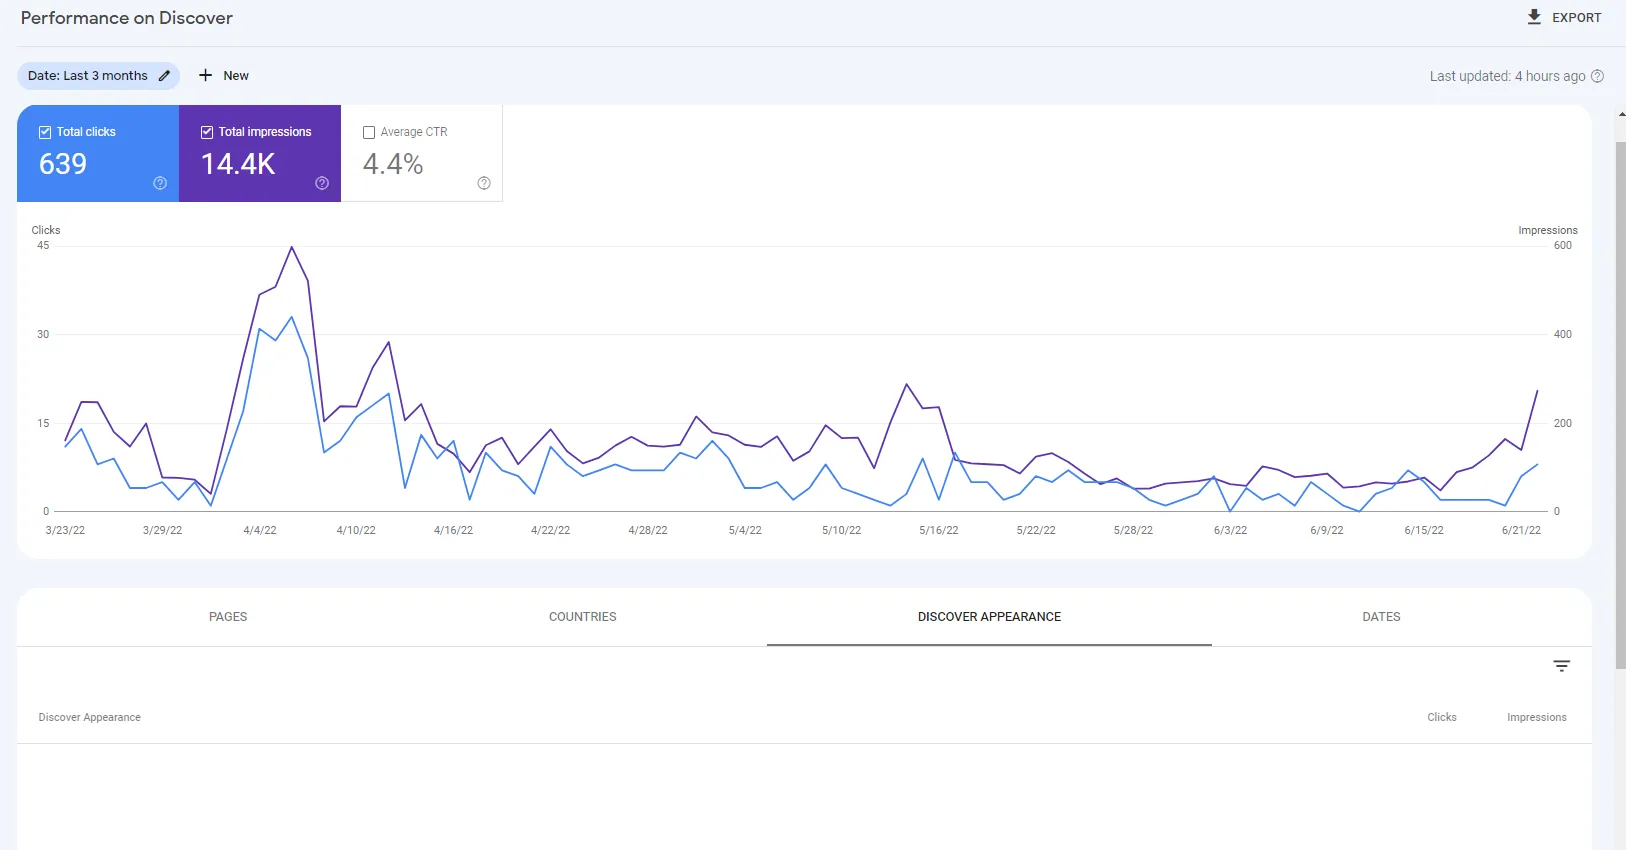
When this glossary was first written (June 2022), source attribution wasn’t yet populating — 639 Discover clicks showed with no source breakdown — marking it as a report still in development.
Indexing and coverage
Coverage (Page indexing)
The Coverage report — now called Page indexing — shows which of your pages Google has indexed and which it hasn’t, grouped by status and reason. The most common statuses:
- All known pages — every URL Google has discovered for the property, indexed or not.
- All submitted pages — URLs Google found through your submitted sitemaps.
- Indexed, not submitted in sitemap — a page Google indexed even though it wasn’t in your sitemap; often a sign of a sitemap gap.
- Crawled — currently not indexed — Google crawled the page but chose not to index it, usually a quality or duplication signal.
- Discovered — currently not indexed — Google knows the URL exists but hasn’t crawled it yet, often a crawl-budget or server-load signal.
- Page with redirect — the URL redirects elsewhere, so it isn’t indexed on its own.
- Alternate page with proper canonical tag — the page correctly points to another canonical, so Google indexes that one instead.
- Duplicate, submitted URL not selected as canonical — you submitted the URL, but Google picked a different URL as canonical.
- Submitted URL marked ‘noindex’ — you submitted a URL that carries a noindex directive.
- Submitted URL not found (404) and Not found (404) — the URL returns a 404.
Sitemaps
The Sitemaps report shows the sitemaps you’ve submitted, when Google last read each one, and how many of its URLs were discovered. It’s your first stop when submitted pages aren’t getting indexed.
Removals
The Removals tool manages requests to hide or refresh URLs in Google Search:
- Temporary removal — hides a page from Google results for about six months after the request is approved.
- Clear cached URL — clears the cached copy and snippet until the page is next indexed.
- Outdated Content — the history of requests submitted through the public Remove Outdated Content tool for this property in the past six months.
- SafeSearch filtering — requests to flag pages as adult content for SafeSearch.
Page experience
Page Experience
The Page Experience report summarizes how many of your URLs deliver a good experience, combining Core Web Vitals, mobile usability, and HTTPS into a single view. Its data comes from the Chrome User Experience Report — real usage from Chrome users around the world, not lab tests.
Good URLs
Good URLs is the percentage of your URLs with both a Good status in Core Web Vitals and no mobile-usability issues, as of the last chart date. “Total impressions of good URLs” is the search impressions those pages earned over the charted period.
Core Web Vitals
Core Web Vitals are Google’s three field metrics for loading, interactivity, and visual stability. A URL rated Poor or Needs improvement in the Core Web Vitals report is marked Failing in Page Experience. The three metrics:
- LCP (Largest Contentful Paint) — how long the page takes to render its largest visible element.
- FID (First Input Delay) — how long the page takes to start responding to a user action.
- CLS (Cumulative Layout Shift) — how much the page’s layout shifts around during loading.
Aggregate metrics and similar URLs
To report at scale, GSC groups pages with similar content and resources, on the assumption that they share the same underlying issue. Similar URLs are the other members of that group; the Examples table shows one representative URL. Aggregate LCP is the time it takes for 75% of visits to URLs in the group to reach LCP.
Mobile Usability
The Mobile Usability report flags URLs that are hard to use on phones, and those failures mark a URL as Failing in Page Experience. Common issues include text too small to read, content wider than the screen, incompatible plugins, and clickable elements placed too close together.
HTTPS
The HTTPS report flags whether a meaningful share of your pages still serve over HTTP; if so, you’ll see an HTTPS warning, though only the HTTP pages are affected.
URL inspection
URL Inspection tool
The URL Inspection tool reports exactly how Google sees a single URL — its index status, canonical, crawl and render details, and any enhancements — and lets you test the live version and request indexing. Key controls and fields:
- View crawled page — the HTML, screenshot, and details from Google’s last crawl of the indexed version.
- Request indexing — asks Google to crawl and consider the URL, useful after publishing or fixing a page.
- Test live URL — fetches the current live version so you can compare it against the indexed version and view its HTML, screenshot, and more info.
- Crawled as — which crawler fetched the page (Googlebot smartphone or desktop).
- Crawl allowed / Page fetch / Indexing allowed — whether robots rules permitted the crawl, whether the fetch succeeded, and whether the page allows indexing.
User-declared vs. Google-selected canonical
The user-declared canonical is the URL you name as authoritative (via a canonical tag, sitemap, or redirect). The Google-selected canonical is the URL Google actually treats as authoritative, which can differ from yours. Other versions may still surface for certain devices or languages. The Google-selected canonical isn’t available in the live test, because Google only chooses one after a page is indexed.
Links
External and internal links
The Links report counts the links pointing to your site and moving around inside it. External links come from outside your property to your property; internal links go from your property to your property. Related views break this down further:
- Top linking sites — external domains linking to you most, trimmed to root domain and grouped.
- Top linking text — the anchor text external pages use to link to you.
- Top linked pages (external) — your pages that outside sites link to most.
- Top linked pages (internal) — your pages that your own pages link to most.
- Total external links — the number of unique links to the property from outside it.
Crawl stats
Crawl Stats report
The Crawl Stats report shows how Google crawls your site over the last 90 days — request volume, download size, response time, and host health. It’s essential for large sites where crawl budget and server load are real constraints. Core metrics:
- Total crawl requests — all crawl requests to your site in the period, including duplicate requests to the same URL.
- Total download size (bytes) — the size of all files and resources downloaded while crawling; already-cached resources aren’t counted.
- Average response time (ms) — average time to retrieve page content, excluding resource fetches and rendering.
Host status
Host status summarizes your site’s availability to Googlebot over the last 90 days, warning you if issues appeared recently. It rests on three checks:
- Robots.txt fetch — whether Google could request your robots.txt; a fetch is successful if it returns the file (200) or a clean 404, and an error if failures exceed a daily baseline.
- DNS resolution — whether Google hit DNS problems reaching your site, judged against a daily error-rate baseline.
- Server connectivity — whether Google hit connection problems, judged the same way.
Crawl breakdowns
Crawl Stats also groups requests to help you diagnose patterns: by response (200, 301 moved permanently, 304 not modified, 5xx server error), by file type, by purpose (refresh of a known page vs. discovery of a new one), and by Googlebot type (smartphone, desktop, image, and the resource-loading bot).
Security and manual actions
Manual Actions
A manual action is a penalty a human reviewer at Google applies when a site violates the spam guidelines, demoting or removing affected pages until you fix the issue and pass a reconsideration request.
Security Issues
The Security Issues report flags signs your site has been hacked or is serving malware, deceptive pages, or unwanted software to users.
International Targeting
The International Targeting report helps multi-region sites confirm their hreflang annotations are valid and set a country target where appropriate.
Ad Experience and Abusive Experiences
These reports flag intrusive or deceptive ad and notification patterns — abusive experiences, abusive notifications, and violations of the Better Ads Standards — that can hurt how Chrome and Google treat your site.